Number of projected deaths in daily in New Orleans
State of Louisiana COVID-19 Data Models Show Thousands of New Hospitalizations Daily Without Effective Social Distancing Measures
BATON ROUGE — Louisiana’s modeling data show the state on course to require 2,500 new hospitalizations a day in the New Orleans area by mid-May, if the public does not adhere to COVID-19 mitigation measures like Gov. Edwards’ Stay at Home order.
Governor Edwards and the Louisiana Department of Health on Friday shared a product of the state’s COVID-19 modeling that takes into account the Governor’s aggressive mitigation measures.
“There are increasing efforts across the country to understand the impact of social distancing, school closures, stay at home orders and other mitigation measures as we strive to flatten the curve and slow the spread of this virus,” said Governor John Bel Edwards. “What we are seeing is that many Louisianans are taking this seriously. Unfortunately, there are still others who are not, and perhaps it is because we have not fully impressed upon all of our citizens the serious consequences of not staying at home.”
Projections are based on modeling that accounts for the rate of hospitalization and death, as well as the capacity of health care facilities and medical surge efforts in each region. Each scenario is based on the number of new people a COVID-19 positive patient infects. In the most favorable scenario, this number is lower, with fewer people being infected and fewer health care resources needed.
Louisiana releases data about hospitalized cases and hospital and ventilator use each day on its COVD-19 dashboard at ldh.la.gov/coronavirus
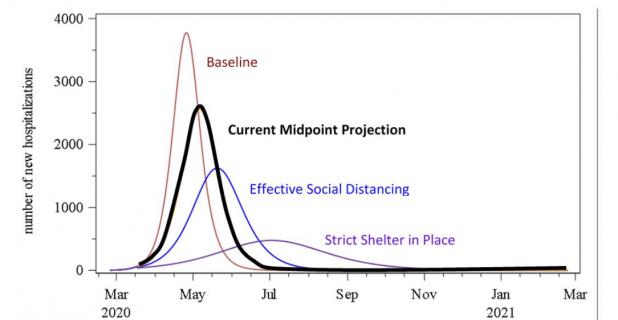
The product of the Department’s COVID-19 model shows differing scenarios based on how well the public participates in different mitigation efforts. This graph shows projected new hospitalizations per day under four different scenarios in Region 1 (the Greater New Orleans Area). As the Department builds out additional regional projections, it will share them with the public.
“The consequences of not staying at home are real. You have heard me talk about flattening the curve before, and so might wonder why there are four curves here,” continued Governor Edwards. “These are four different scenarios based on actions we all take now.”
The high red curve is Louisiana’s baseline, or what would happen without any measures taken. This is the state’s worst-case scenario – there is a rapid rise in new hospitalizations, adding intense strain to the state’s overwhelmed health care system. In this scenario, many people will die.
“We all have the power to determine the path we end up on. We are not strangers to hurricane maps and projections in Louisiana. In some ways this graph is no different. Like projected paths of a hurricane these curves show different potential paths of coronavirus in Louisiana,” said Governor Edwards. “Importantly, unlike a hurricane, we have the ability to redirect the path of this virus.”
These blue and purple curves show the impact of social distancing and staying at home. These are much flatter curves, meaning far fewer people enter the hospital on any one day.
“On the purple curve or scenario where everyone complies with the stay at home order, the Greater New Orleans region’s health care system would have the time and the ability to take care of us as we get sick. It means far fewer of our neighbors, family members and friends will die,” said Dr. Alex Billioux, the Assistant Secretary of the Office of Public Health. “Unfortunately this is likely not the case on the blue curve or scenario where everyone is effectively social distancing in the region. Social distancing is a valuable shield against coronavirus, but it is not as strong as staying at home.”
The black curve shows the midpoint scenario and what the state is currently using to plan.
The above projections are dynamic and by definition will change with new underlying data. Changes in projections are largely driven by changing conditions on the ground. In summary, the Department generates these projections for the purposes of knowing what curve Louisiana is on and in what direction the state is trending. This will allow officials to better plan and allocate resources, and also so the public can clearly see that full compliance with the Stay at Home order and social distancing will produce the best possible outcome and save thousands of lives.